Every study needs its own statistical tools, adapted to the specific problem, which is why it is a good practice to require that statisticians come from mathematical probability rather than some software-cookbook school. When one uses canned software statistics adapted to regular medicine (say, cardiology), one is bound to make severe mistakes when it comes to epidemiological problems in the tails or ones where there is a measurement error. The authors of the study discussed below (The Danish Mask Study) both missed the effect of false positive noise on sample size and a central statistical signal from a divergence in PCR results. A correct computation of the odds ratio shows a massive risk reduction coming from masks.
The article by Bundgaard et al., [“Effectiveness of Adding a Mask Recommendation to Other Public Health Measures to Prevent SARS-CoV-2 Infection in Danish Mask Wearers”, Annals of Internal Medicine (henceforth the “Danish Mask Study”)] relies on the standard methods of randomized control trials to establish the difference between the rate of infections of people wearing masks outside the house v.s. those who don’t (the control group), everything else maintained constant.
The authors claimed that they calibrated their sample size to compute a p-value (alas) off a base rate of 2% infection in the general population.
The result is a small difference in the rate of infection in favor of masks (2.1% vs 1.8%, or 42/2392 vs. 53/2470), deemed by the authors as not sufficient to warrant a conclusion about the effectiveness of masks.
We would like to alert the scientific community to the following :
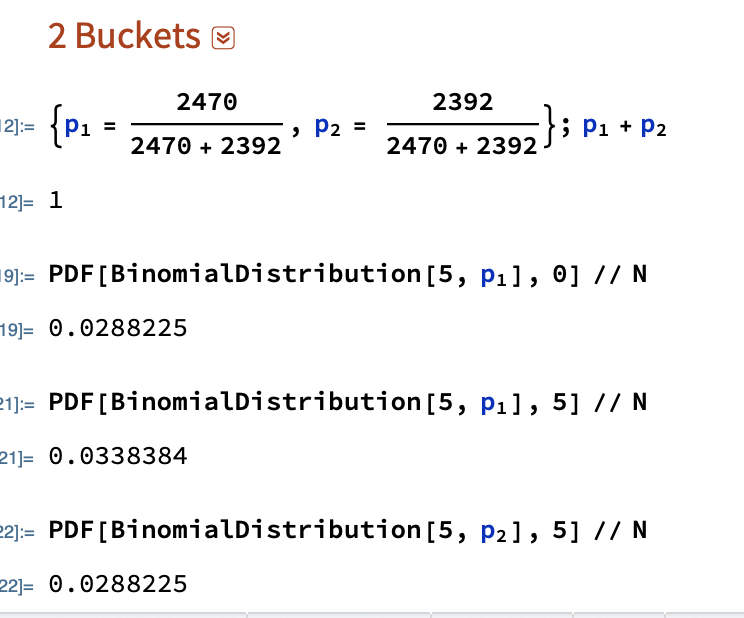
- The Mask Group has 0/2392 PCR infections vs 5/2470 for the Control Group. Note that this is the only robust result and the authors did not test to see how nonrandom that can be. They missed on the strongest statistical signal. (One may also see 5 infections vs. 15 if, in addition, one accounts for clinically detected infections.)

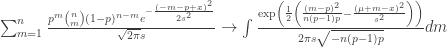
- The rest, 42/2392 vs. 53/2470, are from antibody tests with a high error rate which need to be incorporated via propagation of uncertainty-style methods on the statistical significance of the results. Intuitively a false positive rate with an expected “true value”
is a random variable
Binomial Distribution with STD
, etc.
- False positives must be deducted in the computation of the odds ratio.
- The central problem is that both p and the incidence of infection are in the tails!
Immediate result: the study is highly underpowered –except ironically for the PCR and PCR+clinical results that are overwhelming in evidence.
Further:
- As most infections happen at home, the study does not inform on masks in general –it uses wrong denominators for the computation of odds ratios (mixes conditional and unconditional risk). Worse, the study is not even applicable to derive information on masks vs. no masks outside the house since during most of the study (April 3 to May 20, 2020), “cafés and restaurants were closed “, conditions too specific and during which the infection rates are severely reduced –tells us nothing about changes in indoor activity. (The study ended June 2, 2020). A study is supposed to isolate a source of risk; such source must be general to periods outside the study (unlike cardiology with unconditional effects).
- The study does not take into account the fact that masks might protect others. Clearly this is not cardiology but an interactive system.
- Statistical signals compound. One needs to input the entire shebang, not simple individual tests to assess the joint probability of an effect.
Now, some quick technical derivations.
Distribution of the sample under type 2 error
Simple method: Let 


with the constraint that 
So 

If we consider 


This poses an immediate problem: we are concerned with 


A back of the envelope analysis shows that, in the presence of a false positive rate of just 1%, we have a large gain for masks. It would not be 42/2392 vs. 53/2470 but rather, by adding the known true positives and reducing by the false negatives (approximately):


which is at least an overall drop in 47% of incidence for masks, not counting home infections, which, if they were just 1% (half the total claimed by the resarchers), would increase the benefits for masks in a yuuuuuuuge way (up to 100%).
(These numbers are preliminary and need refining).
More advanced method: Let the initial incidence rate 


Under normal approximation to the binomial:
Allora

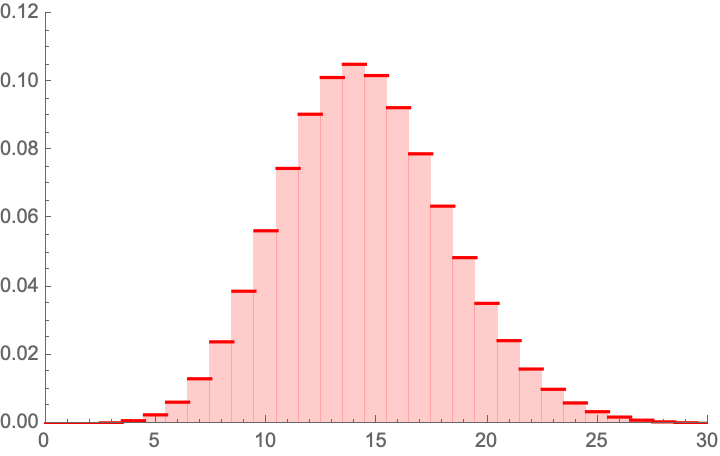
which appears to be Gaussian. For we have:


As you see the variance goes through the roof. More details would show that the study needs at least 4 times the sample size for the same approach. I have not added false negatives, but these too would increase the variance.
Considerations on the 0/5 PCR results
Now consider the more obvious error. What are the odds of getting 0 PCRs vs 5 from random?
The probability of having 0 realizations in 2392 if the mean is 
 ) .
) .


Considerations on the 5/15 PCR+Clinial detection results
Now consider the 5 vs. 15 PCR + (adjusting the rest)
 ) .
) .Clinically detected Covid.
The probability of having 5 or less realizations in 2392 if the mean is
(To be continued. I wonder why the journal published a paper with already weak p values, without asking for a repeat with a larger sample which can cure the deficit.)

In principle I agree with most of your observations.
My understanding is that the rt-PCR test results would produce the following contingency table:
Sick vs Healthy
Group1: 0 vs 2392
Group2: 5 vs 2465
As group sizes are very similar, one can get a quick and dirty p value estimate as p ~= (1/2)^5 = 1/32 ~= 0.03125 (i.e. what is the chance that all 5 sick belonged to the the group without masks purely by chance)
Otherwise, one can evaluate a statistical test on this contingency table. One-tailed Fischer’s exact test would produce a p value of 0.0338 (very similar to the quick and dirty estimate).
In the meantime you get the p value of 0.0078518
What am I missing?
LikeLiked by 1 person
Hi there
the probability is not ½.
LikeLike
Try again with 5/2400
LikeLike
Indeed, under the null hypothesis that there is no difference between masks and no masks the existing infections are equally likely to occur in both groups, hence indeed the chance of getting all 5 in one group is 2465(2465-1)…(2465-4)/((2392+ 2465)(2392+ 2465-1)…(2392+ 2465-4)) which should indeed be close to 1/32. I am not sure what is the justification for taking a mean value for one group and applying the binominal distribution the way Taleb does. His point still remains valid however.
LikeLike
Right! It’s a heuristic that replaces having to look at the difference in means as the diff is complicated for n1!= n2.
LikeLike
Hi. Thanks. It is important you, not me, reply to thiese derogatory comment of you. Paul Fritjers is prominent in Gt Barrington and let her rip. And LSE.
Best replies come from the horses mouth. Over to you. Your detractor:
Author of clip of long comment below:
https://www.lse.ac.uk/social-policy/people/Emeritus-Visiting/professor-paul-frijters
****
Paul Frijters says:
November 26, 2020 at 11:14 pm
“On the other thread, Nick asked “Hi Paul, do you have any comments on Nassim Taleb’s attack on the Danish study?”
“Just for you, I had a look, and am not impressed. Let me say why, but first explain his basic argument in plain English in case his eloquence escapes you. His main claim is that … ” …
“1. Nassim is one-sided in his “false positive rate” argument. …
“2. He claims a false-positive rate on the anti-body tests but then doesn’t follow up to have a look at how large that issue actually is likely to have been. He hasn’t asked the authors, nor took a look at the details of the Danish study and related the particulars of their test regimes to what is known now in the literature on false-positives. So he is basically lazy and claiming “gotcha” without truly informing the reader of whether his point is relevant at all. . ..
“3. Nassim plays the one-sided game again when saying the Danish environment didn’t have certain kinds of mixing in pubs and such during this period since the pubs were closed for much of the period. That’s true, but also true for many places that have compulsory face masks, meaning that the Danish study does give you an answer on the usefulness of masks in circumstances that go beyond just Denmark that period. Nassim makes it seem as if having facemasks but closed pubs is something unusual that makes the study irrelevant, whilst that congruence is the situation right now in Greece, the UK, and many other countries. Again, very naughty.”…
“After seeing him play his tricks a couple of times, I regard Nassim as a non-scientist with a large following of gullible people. I treat him like a weather vane for whether someone can spot whether they are being played or not: if someone can’t see through his constant technical trickery, I regard them a lay person who faces the difficulty of not knowing whom to trust. If they should be able to see through it but enthousiastically promote it anyway because they like the conclusion he always comes to, I regard them as morally corrupt.
“This latest missive doesnt make me change my mind on that initial assessment. Same trickery, same conclusion-lead approach, same followers.
“Unfortunately, this behaviour is normal for Nassim in this period.
“At the start of the pandemic I saw a couple of videos by Nassim and noticed him playing these same tricks constantly. He for instance did it with …
“After seeing him play his tricks a couple of times, I regard Nassim as a non-scientist with a large following of gullible people. I treat him like a weather vane for whether someone can spot whether they are being played or not: if someone can’t see through his constant technical trickery, I regard them a lay person who faces the difficulty of not knowing whom to trust. If they should be able to see through it but enthousiastically promote it anyway because they like the conclusion he always comes to, I regard them as morally corrupt.
“This latest missive doesnt make me change my mind on that initial assessment. Same trickery, same conclusion-lead approach, same followers.”…
Person asking re Danish mask study…
https://en.m.wikipedia.org/wiki/Nicholas_Gruen
https://lateraleconomics.com.au/
LikeLike
Hi there,
Here you have a happiness economist as an arbiter of technical work in probability? It is like asking an illiterate farmer to comment on quantum mechanics.
LikeLiked by 1 person
[…] HYPOTHESIS TESTING IN THE PRESENCE OF FALSE POSITIVES: THE FLAWS IN THE DANISH MASK STUDY Nassim Nicholas Taleb and Discussion with Yaneer Bar-Yam on the Danish Study on Face Masks YouTube: “Basically, there’s no paper.” INET also has a takedown of the Danish study, to publish soon. […]
LikeLike
Hi Nassim, great post! Thank you! I wonder if there is a small typo: in the exponent to e in the definition of the density f of ” the corrected distribution”, shouldn’t we have (-m – mu + x)^2 / 2s^2 and not (-m – p + x)^2 / 2s^2. If we assume independence between the infection rate X and the number of false positives, then in the event of m false positives we would have an normally distributed infection rate with mean m + mu. Right?
LikeLiked by 1 person
or perhaps rather (-m/n – mu + x)^2 / 2s^2.
LikeLiked by 1 person
Hi,
You say about the PCR results that the authors did not test how non-random it can be. However they do present a p-value for that contrast, in the table that you show immediately below. “The between-group differences in frequencies of positive SARS-CoV-2 RT-PCR were not statistically significant (P = 0.079)”.
Whether it is a reasonable test is a different question though. The p-value they present is what I get if I run a Pearson’s Chi-squared test of the contingency table, which is presumably not the best thing to do when there are cell sizes = 0. But they do test for it.
There are also in the paper estimates of the specificity and the sensitivity of the antibody test, that could be used to model the impact of false positives and negatives.
LikeLike
Hi Andreas. Explain how can they be non-statistically significant.
LikeLike
Hi Nassim. Sorry I should clarify. I’m not claiming that the difference in RT-PCR data is not significant, that claim is from the article. I was simply pointing out that they did not neglect the result, nor omitted testing for its non-randomness. It is relevant because it shows their reasoning about these measures. I believe their p-value estimate results from using a textbook test without checking its assumptions, which kind of proves your point that they should have involved a statistician in the team.
I do have a question if I may, pertaining to my other point. I like the idea of adjusting for false positives. But I don’t understand why you take 1% as an estimate of the false positive rate? In the paper they give two different point estimates of specificity, one from the manufacturer of the tests (99.2%) and one from a previous validation study from the same team (99.5%) [beginning of p3 in the article]. Therefore it seems that either 0.8% or 0.5% would be more reasonable estimates of false positive rates (I am assuming False positive rate = 1-Specificity).
LikeLike
Dear Nassim,
For the 5 vs 0 PCR positive result the p value you calculate is flawed. The correct way to do it would e.g. be using a Firth logistic regression. Using R that would give you:
library(brglm)
summary(brglm(cbind(pcrpos, pcrneg) ~ treatment, family=binomial, data=data.frame(treatment=factor(c(“masks”,”nomasks”)),
pcrpos=c(0,5), pcrneg=c(2392,2470-5))))
2-sided p=0.11.
So that’s not significantly different.
Alternatively, you might use a Fisher’s exact test, which would give you :
fisher.test(cbind(c(0,2392),c(5,2470-5))):
2-sided p = 0.06.
Again, not significantly different.
A Firth logistic regression would be more appropriate though, since we have a clear outcome variable here and we don’t just want to test for an association in a 2×2 contingency table, as one would do using a Fisher’s exact test. For details see Firth, D. (1993). Bias reduction of maximum likelihood estimates. Biometrika 80, 27–38. A regular logistic regression doesn’t work here btw because of complete separation, https://en.wikipedia.org/wiki/Separation_(statistics) https://stats.stackexchange.com/questions/11109/how-to-deal-with-perfect-separation-in-logistic-regression. Going Bayesian would also be a solution, e.g. using the bayesglm() or brms package, or one could use an L1 or L2 norm or elastic net penalized binomial GLM model, e.g. using glmnet.
But the p value you calculate above is definitely not correct. Sometimes it helps to not try to reinvent the wheel.
I do agree with all the shortcomings of this study in general though. It certainly was massively underpowered.
best regards,
Tom Wenseleers
LikeLike
Please don’t give me libraries. Please provide derivations.
LikeLike
Well, the derivation of Fisher’s exact test you can find in most Statistics 101 courses, see e.g. https://mathworld.wolfram.com/FishersExactTest.html. For Firth’s penalized logistic regression, see https://medium.com/datadriveninvestor/firths-logistic-regression-classification-with-datasets-that-are-small-imbalanced-or-separated-49d7782a13f1 for a derivation. Or in Firth’s original article: https://www.jstor.org/stable/2336755?seq=1#metadata_info_tab_contents.
Technically, the problem with the way you calculated your p value above is that you use a one-sample binomial test, and assume there is no sampling uncertainty on the p=5/2470. Which is obviously not correct. So you need a two-sample binomial test instead, which you could get via a logistic regression. But since you have complete separation you then can’t use a standard binomial GLM, and have to use e.g. a Firth penalized logistic regression instead. Anyway, the details are in the links above.
cheers,
Tom
LikeLike
I did not do p-values.
LikeLike
You write “The probability of having 0 realizations in 2392 if the mean is \frac{5}{2470} is 0.0078518, that is 1 in 127. We can reexpress it in p values, which would be <.01". This statement is obviously not correct then.
LikeLike
Yes “reexpress” in terms of ps. I changed to .05. Thanks.
LikeLike
And if you didn’t do p values – well, then your piece above is a little weak as a reply on how the authors should have done their hypothesis testing in a proper way, don’t you think? If the 0 vs 5 PCR positive result is not statistically significant I don’t see how you can make a sweeping statement like “The Mask Group has 0/2392 PCR infections vs 5/2470 for the Control Group. Note that this is the only robust result and the authors did not test to see how nonrandom that can be. They missed on the strongest statistical signal.”. That “strong statistical signal” you mention turns out not be statistically significant at the p<0.05 level if you do your stats properly…
LikeLike
You are conflating p values and statistical significance.
Besides, I don’t do P values. https://arxiv.org/pdf/1603.07532.pdf
LikeLike
Well you can also work with Bayes Factors if you like. Anything more formal than what you have above should do really… But just working with a PMF of a binomial distribution, and ignoring the sampling error on the 5/2470 control group is not OK. And if you’re worried about the accuracy of p values you could always still calculate 95% confidence limits on them, right? Also not really what people would typically consider p-hacking…
LikeLike
It is not the p hacking but the stochasticity of p.
And I am not using the raw difference as a metric but a heuristic. Which part of “reexpress” you are not getting?
LikeLike
Yes I get that, but I think your title may a bit of a misnomer then. And as I mentioned: if one is worried about the accuracy of your p values & stochasticity on its estimated value, you can always calculate p-value prediction intervals, https://royalsocietypublishing.org/doi/10.1098/rsbl.2019.0174.
LikeLike
You are NOT getting it.
If one uses a double Bernouilli one gets results <.05. See updated picture.
I am tired of canned probability.
LikeLike
Forget about p-values. You have observed 5/2470 infections in the control group. How confident are you that the true infection rate is not 4/2470? 3/2470?
If it’s 3/2470, that could more easily generate the observed 0/2392 in the mask group. There is some evidence here that masks reduce the infection rate, but not much.
However you compute statistical significance needs to take into account sampling error in both the control and mask group infection estimates.
LikeLiked by 1 person
Yes I did below with the Monte Carlo.
LikeLike
You are still ignoring the sampling uncertainty on the 0/2392. If you would like to go Monte Carlo you can use an exact-like logistic regression (https://www.jstatsoft.org/article/view/v021i03/v21i03.pdf). Using R, that gives me
For the 0 vs 5 PCR positive result:
library(elrm)
set.seed(1)
fit = elrm(pcrpos/n ~ treatment, ~ treatment,
r=2, iter=400000, burnIn=1000,
dataset=data.frame(treatment=factor(c(“masks”, “control”)), pcrpos=c(0, 5), n=c(2392, 2470)) )
fit$p.values # p value = 0.06, ie just about not significant at the 0.05 level
fit$p.values.se # standard error on p value = 0.0003
# this is very close to the 2-sided Fisher exact test p value
fisher.test(cbind(c(0,2392), c(5,2470-5))) # p value = 0.06
For the 0 vs 15 result:
set.seed(1)
fit = elrm(pcrpos/n ~ treatment, ~ treatment,
r=2, iter=400000, burnIn=1000,
dataset=data.frame(treatment=factor(c(“masks”, “control”)), pos=c(5, 15), n=c(2392, 2470)) )
fit$p.values # p value = 0.04 – this would be just about significant at the 0.05 level
fit$p.values.se # standard error on p value = 0.0003
So some evidence for the opposite conclusions as what they have (especially for the 5 vs 15 result), but still not terribly strong.
Details of method are in https://www.jstatsoft.org/article/view/v021i03/v21i03.pdf.
I can see you don’t like canned statistics. And you could recode these kinds of methods quite easily in Mathematica if you like, see here for a Fisher’s exact test e.g.:
https://mathematica.stackexchange.com/questions/41450/better-way-to-get-fisher-exact.
But believe me – also Sir Ronald Fisher will have thought long and hard about these kinds of problems. And he would have seen in seconds that what you do above is simply not correct. Quite big consensus on that if I read the various comments here by different people…
LikeLike
What are you testing?
Are you testing if sample 1> sample 2? THen why the fuck are you doing a two tailed test?
LikeLike
I was testing the hypothesis of there being no difference in infection rate between both groups and so was doing 2-sided tests. Some have argued that masks could actually make things worse if not used properly. So not doing a directional test would seem most objective to me. But if you insist, then yes, you could use 1-tailed p values… Then you would get 1-sided p values of 0.03 and 0.02 for the 0 vs 5 and 5 vs 15 sections of the data. Still deviates quite a bit from the p<0.01 that you first had.
LikeLike
You don’t get it.
BTW I added a double column table joint distribution a la Fisher.
LikeLike
In terms of double column joint distribution: then I think your code above should have e.g. 15/2470 and 5/2392 as your expectation of the Bernoulli distribution for vs 5 vs 15 comparison. But that would give problems for the 0/2392 outcome for the masks group in the 0 vs 5 comparison. As simulated Bernouilli trials with p=0 will be all zeros. Also, right now I don’t see where that 2400 was coming from in your code. I get that you are doing a one-sided two-sample binomial test here via a MC approach. That’s not the same than a Fisher exact test though.
LikeLike
You seem to be very very ignorant, repeating formulas like a parrot, not understanding what probability is about. I’ve stopped engaging with you.
LikeLike
It just strikes how your calculations are all more like “back of the envelope p values”, so not terribly formal.
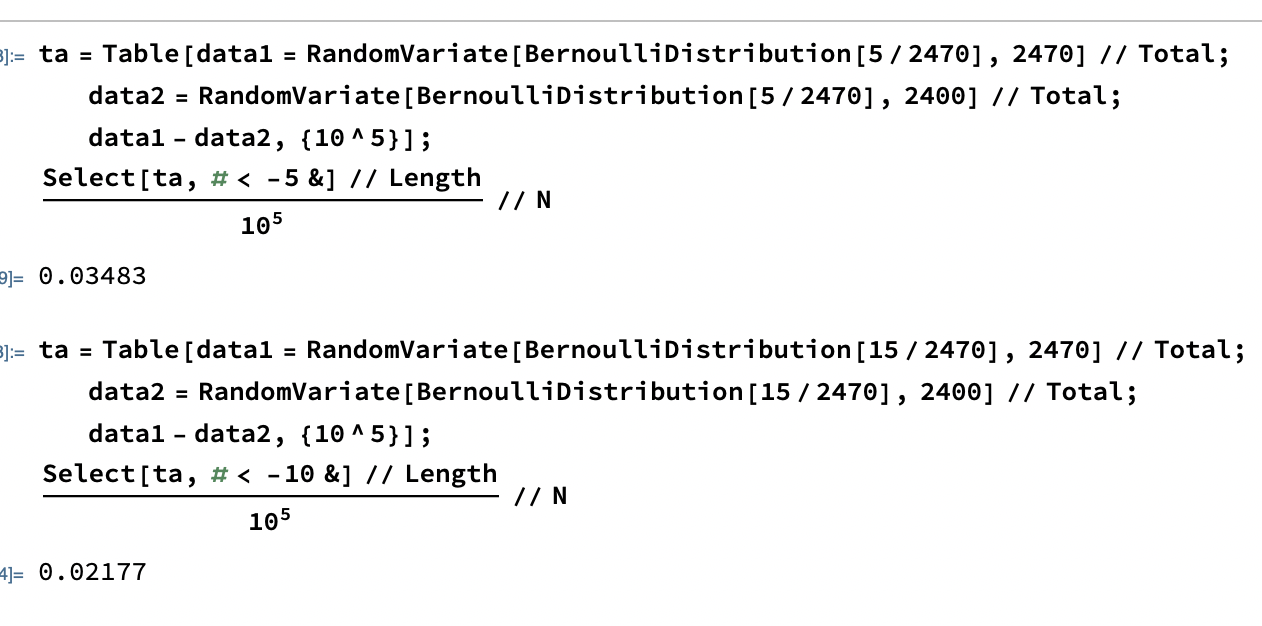
E.g. in your Monte Carlo double Bernoulli “double column table joint distribution a la Fisher”
ta = Table[
data1 = RandomVariate[BernoulliDistribution[5/2470], 2470] // Total;
data2 = RandomVariate[BernoulliDistribution[5/2470], 2400] // Total;
data1 – data2, {10^5}];
[[Select[ta, # < -5 &] // Length]/10^5] // N
0.03483
you estimate the probability of a difference of at least 5 between the 2 samples, assuming a population mean of 5/2470 in both. But this still doesn't account for the sampling error on the 5/2470 as one would typically do in a 2-sample binomial test. And why are you rounding 2392 to 2400?
And what would be wrong with just doing your 1-tailed p value in an exact way following Fisher
a = 0; b = 2392; c = 5; d = 2470 – 5; n = a + b + c + d;
Binomial[a + b, a]*Binomial[c + d, c]/Binomial[n, b + d] // N
0.033771
If you make statements like "The probability of having 0 realizations in 2392 if the mean is 5/2470 is 0.0078518, that is 1 in 127. We can reexpress it in p values, which would be well <.05." just don't make any sense as there is no way to somehow recalculate your first number of 0.007818, derived from the PMF of binomial distribution with p=5/2470 into a p value, as you have to take into account the sampling error on the 5/2470.
And one the point of using 1-tailed vs 2-tailed tests: 2-tailed tests could well be more appropriate is masks would happen to make things worse, e.g. due to bad usage.
LikeLike
Certainly an underpowered study, but PCR or PCR+clinical only data are not conclusive either considering high false negative rates of PCR, because as specific as PCR can be it could have relatively low sensitivity which could result in many more infections going undetected than detected at such small rates but this depends on how many PCR tests were performed
LikeLike
So?
LikeLike
in second part of your post when you estimate p-values for significance of 0/5 PCR and 5/15 PCR+clinical results, as the p-values that you obtain are less than 0.05, it looks like you want to imply that there is evidence for masks being protective, but there isn’t because you haven’t factored in the PCR false negatives which could easily overwhelm those proportions. Overall, the data are inconclusive.
LikeLiked by 1 person
[…] HYPOTHESIS TESTING IN THE PRESENCE OF FALSE POSITIVES: THE FLAWS IN THE DANISH MASK STUDY […]
LikeLike
I’d like to suggest a different focus for the false-positive adjusted analysis. My assumption is that for informing policy about masks, a realistic estimate of the efficacy of mask use, with a narrow enough confidence interval, is more relevant than the question whether the confidence interval contains OR=1. After all, many countries readily accept more intrusive measures (e.g. school and restaurant closures) for which no RCTs exist, and hence no robust (experimental) evidence. Among all things tried face masks might be among the less intrusive, especially if they can help avoiding more freedom-limiting measures.
In practice, policy is of course not so simple as telling everyone to use masks as much as possible, there is always a cost-efficiency factor involved. A realistic estimate of the effect, with a reasonably narrow CI, could make possible efficiency calculations that are currently untenable given Bundgaard et al.’s published conclusions. Here is my attempt at attaining this.
I’ll use Nassim’s method for adjusting the False Positive Rate in antibody test results, ignoring false negatives as they are bound to be few, and then add some “canned statistics” to obtain CIs compatible with the logistic regression models used in the Bundgaard et al. paper.
First, I believe the numerators in the “simple method” suggested by Nassim here needs adjusting – from my reading the clinical and PCR results are already included in the 42 vs. 53 infections in the respective groups. So it is not 42-FP1+5… vs. 53-FP2+15… but rather
(42 – FP1)/2398 vs. (53 – FP2)/2470
FP{1,2} being the expected false positives.
(I’m ignoring home infections too, as it is unlikely that an effective intervention will get people to wear masks at home to any substantial extent.)
According to the Bundgaard et al. paper, the manufacturer’s provided specificity of the antibody test is 99.2%, yielding a False Positive Rate of .008. Using this we get
(42 – .008*2398)/2398 vs. (53 – .008*2470)/2470
a 29.3% reduction in risk due to wearing a mask. Please correct me if I made any errors so far.
Some “canned statistics” on that to get CIs:
OR <- ((42 – .008*2398)/2398)/((53 – .008*2470)/2470)
logOR <- log(OR, base = exp(1))
SE <- sqrt(1/2398+1/2470+1/(42 – .008*2398)+1/(53 – .008*2470))
CIlow <- exp(logOR-1.96*SE)
CIhi OR = .66 [95% CI .36, 1.19]
.5% FPR (lower estimate from the Bundgaard et al. paper, based on a previous study) => OR = .76 [95% CI .47, 1.22]
All this is assuming that the 5 vs. 15 are already included in 42 vs. 53. If I’m wrong about this, substitute accordingly. Obviously, the CIs can be substituted by one’s favourite confidence estimate.
LikeLike
Weird, the last part of my comment above apparently got chopped up somehow. Ignore the CI calculations as they got messed up, but are trivial. Trying again with the text that got lost, containing my main point:
So the false positive-adjusted Odds Ratio is .71 [95% CI .41, 1.21], using the same model as the authors of the paper did. This can be compared to their reported OR = .82 [95% CI .54, 1.23].
Even with my quite conservative adjustment, the only robust finding claimed in the paper is not robust anymore – the estimated risk reduction is no longer significantly lower than 50%, according to the same standard logistic model used by the authors. Nor is it sig. larger than 0%. The CI did not really improve over the unadjusted one (maybe this was obvious a priori, but not to me). Either way I think .71 is a better estimate than the .82 that was reported in the paper, based on Nassim’s reasoning about the expected false positives. And .71 vs. .82 might well have crossed the line for a mask policy to be seriously considered, by some policymaker who rejected .82 as too close to 1.
Sensitivity analysis of the FPR adjustment:
1% FPR (Nassim’s suggestion from the blog post) => OR = .66 [95% CI .36, 1.19]
.5% FPR (lower estimate from the Bundgaard et al. paper, based on a previous study) => OR = .76 [95% CI .47, 1.22]
LikeLike
[…] Taleb notes: Masks work, says Danish study people described as not saying that masks work. […]
LikeLike
[…] Hypothesis Testing in the Presence of False Positives: the Flaws in the Danish Mask Study, em MATHFLANEUR: N N Taleb’s Quant Discussions – Mathematical flaneuring, mostly probability: […]
LikeLike